Exploring the WinDbg Preview JavaScript API
Trying to recreate the x32dbg/x64dbg stacktrace and dereferencing features in WinDbg Preview by leveraging its JavaScript API. Additionally, playing with Time Travel Debugging (TTD) and inspecting memory on the heap. POC included.
- Introduction
- Why WinDbg Preview?
- The WinDbg Preview Shortcoming
- Solution
- WinDbg Preview: Before
- WinDbg Preview: After
- Time Travel Debugging (TTD) Scripting
- !TTDFindCalls - show calls to ‘module!function’
- Example: !TTDFindCalls “ws2_32!recv”
- !TTDFindCalls ”*!*printf”
- !TTDFindCalls “!strcmp”
- Playing With Heaps
- Bonus Content! Configuring WinDbg Preview
- Disable/Uninstall Windows Defender
- Installing WinDbg Preview Offline
- Python versions
- Configuring pykd.dll
- Configuring mona.py
- Other extensions
- OSED Script (epi) Modified for WinDbg Preview
- Conclusion
- Downloads
Introduction
In my spare time I have been slowly inching my way toward the Offensive Security OSED Certification. Great open source projects such as vulnserver and phoenix as well as wonderful blogs by epi, hombre, purpl3 f0x, and others have resulted in some rich content to familiarize myself with related material before actually purchasing the course and lab time.
My reverse engineering experience has centered around x32dbg/x64dbg as my main debugger and the NSA’s Ghidra as a static binary analyzer, disassembler, and decompiler. That said, the OSED requires use of WinDbg | WinDbg Preview and ida free, so I have been slowly getting aquatinted with these tools as well.
Why WinDbg Preview?
Other than the restrictions of the OSED exam, WinDbg offers some advantages over x32dbg/x64dbg. It is more closely integrated with the Windows OS and, perhaps most importantly, it can act as a kernel debugger for debugging the kernel and system drivers. It is most definitely a fantastic tool to learn if you want to learn reverse engineering or low level debugging on Windows.
Beyond that, WinDbg Preview offers some interesting functionality over the classic WinDbg such as: Time Travel Debugging (TTD), a JavaScript API, a modernized UI, and some performance improvements as well. It’s not all roses though, I find the lack of multiple memory windows quite limiting and the Time Travel Debugging output can be a bit buggy when looking at x86 executables, so there are definitely some cons to consider.
The WinDbg Preview Shortcoming
As I have some experience with x32dbg/x64dbg, I quickly noticed a feature that has not been implemented in WinDbg Preview - the ability to see, at a glance, related symbols/dereferenced strings on both the stack and from addresses in registers.
Here are some screenshots to demonstrate what I am talking about using 32bit Vulnserver.exe as an example debugging target.
In x32dbg, I have hooked the recv function of the ws2_32.dll module and sent the following commands:
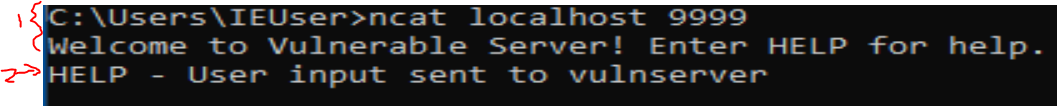
(1) connect to vulnserver
(2) send some custom user input
You’ll notice in x32dbg/x64dbg:
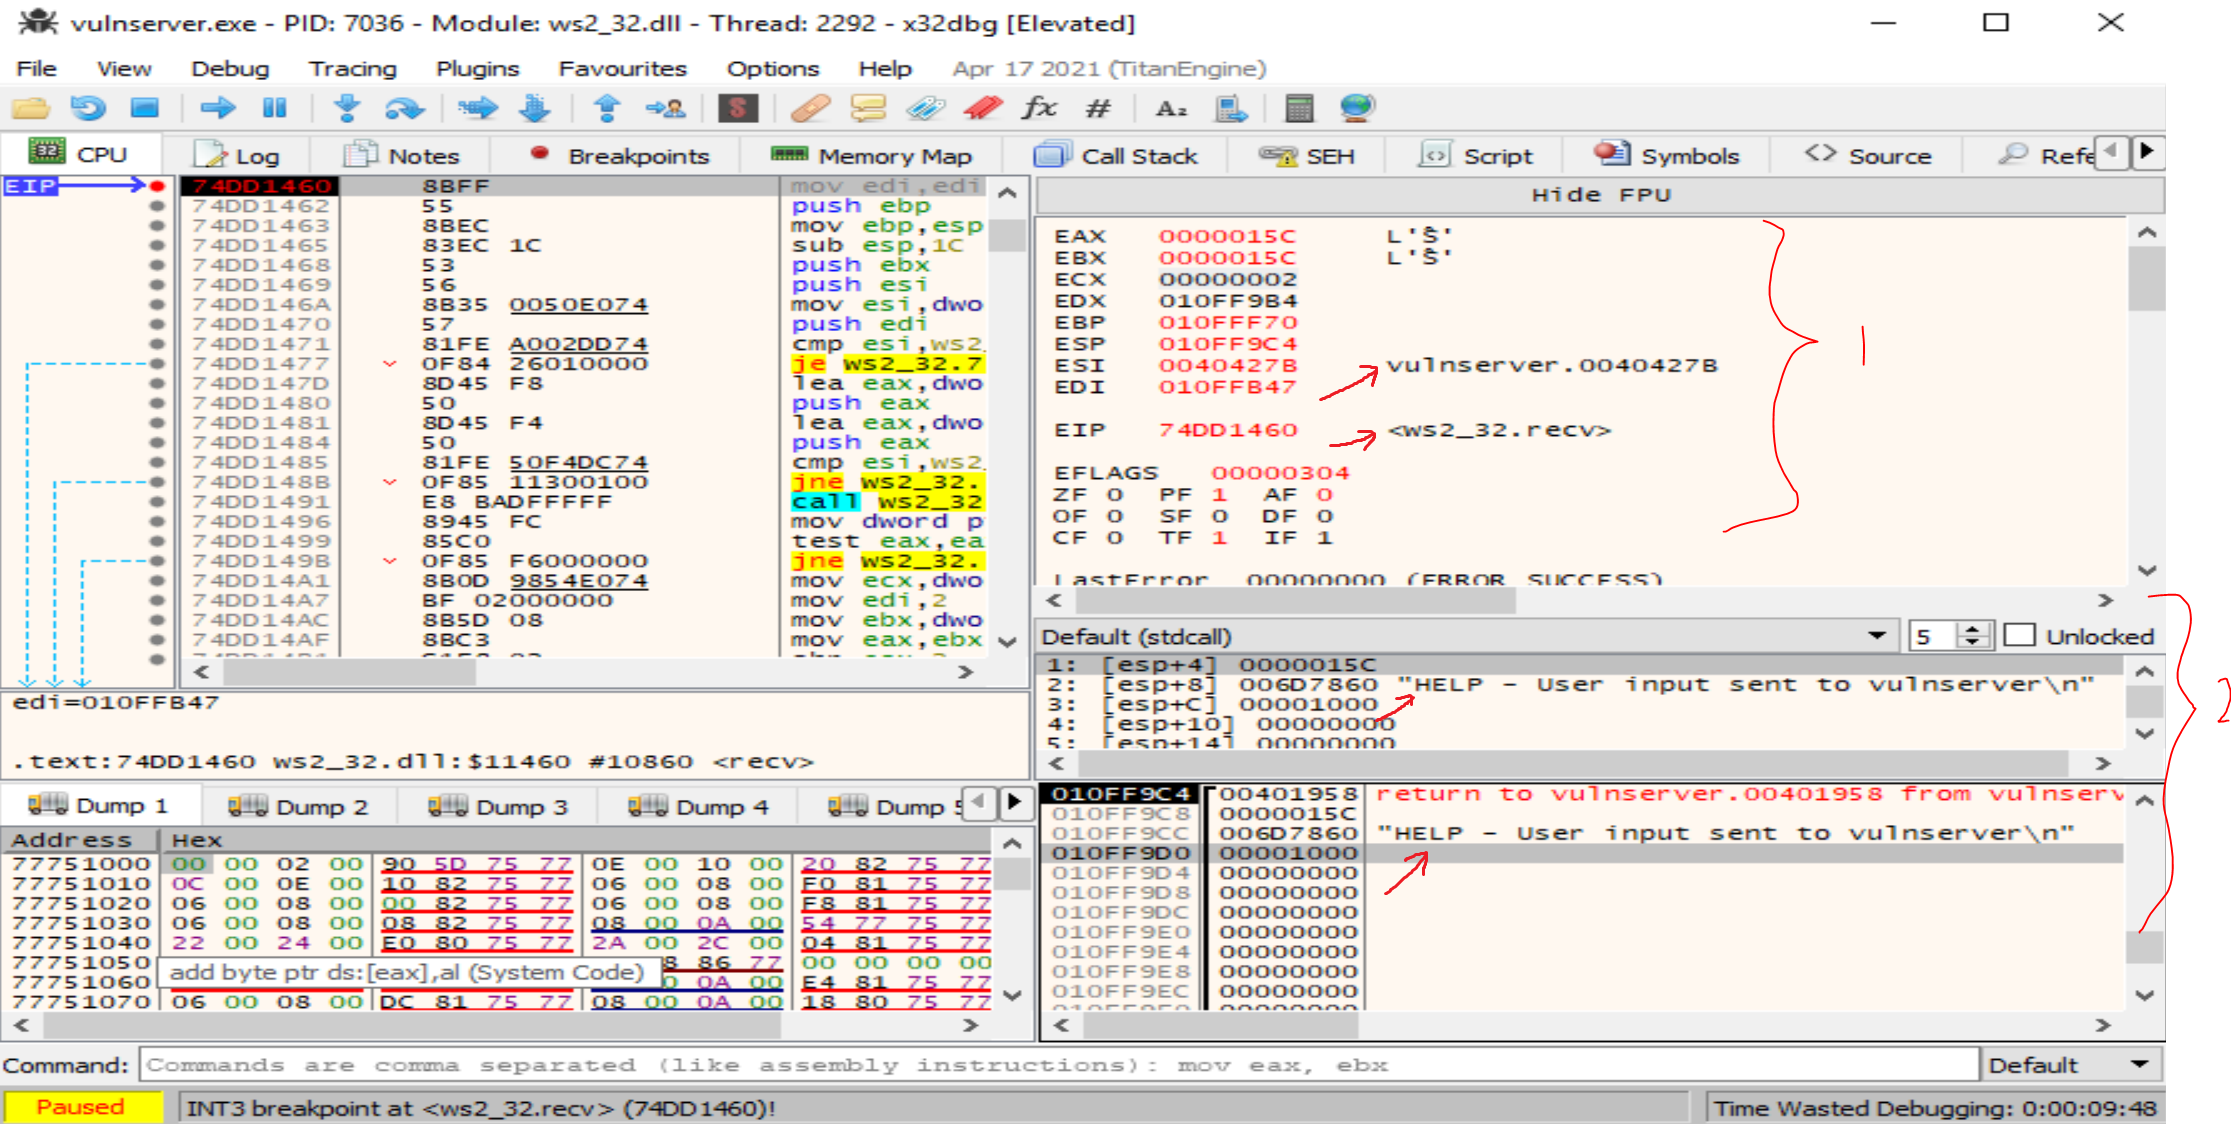
(1) registers are printing some symbol locations and dereferenced string values.
(2) The same is true for the addresses on the stack.
Since this is quite handy, I thought it would be a good exercise to port some of this functionality to WinDbg Preview using the JavaScript API.
Solution
- It’s here that I give an honorable mention to pykd, which has been the primary project for automating WinDbg for years. I believe this may be used to accomplish the same task, but I really wanted to play with the JavaScript API as it also is the closest / most documented way to mess with the new TTD objects which may also prove very useful.
The following sections on WinDbg Preview were made following the same steps as the test with x32dbg above. The debugger was attached to vulnserver.exe.
A breakpoint was set on the recv() function of ws2_32.dll using
bp ws2_32!recvThen user input was sent to the vulnserver from another console by first connecting, and then sending the custom input:
ncat localhost 9999
Help - User input send to vulnserver
WinDbg Preview: Before
This is WinDbg Preview’s output.
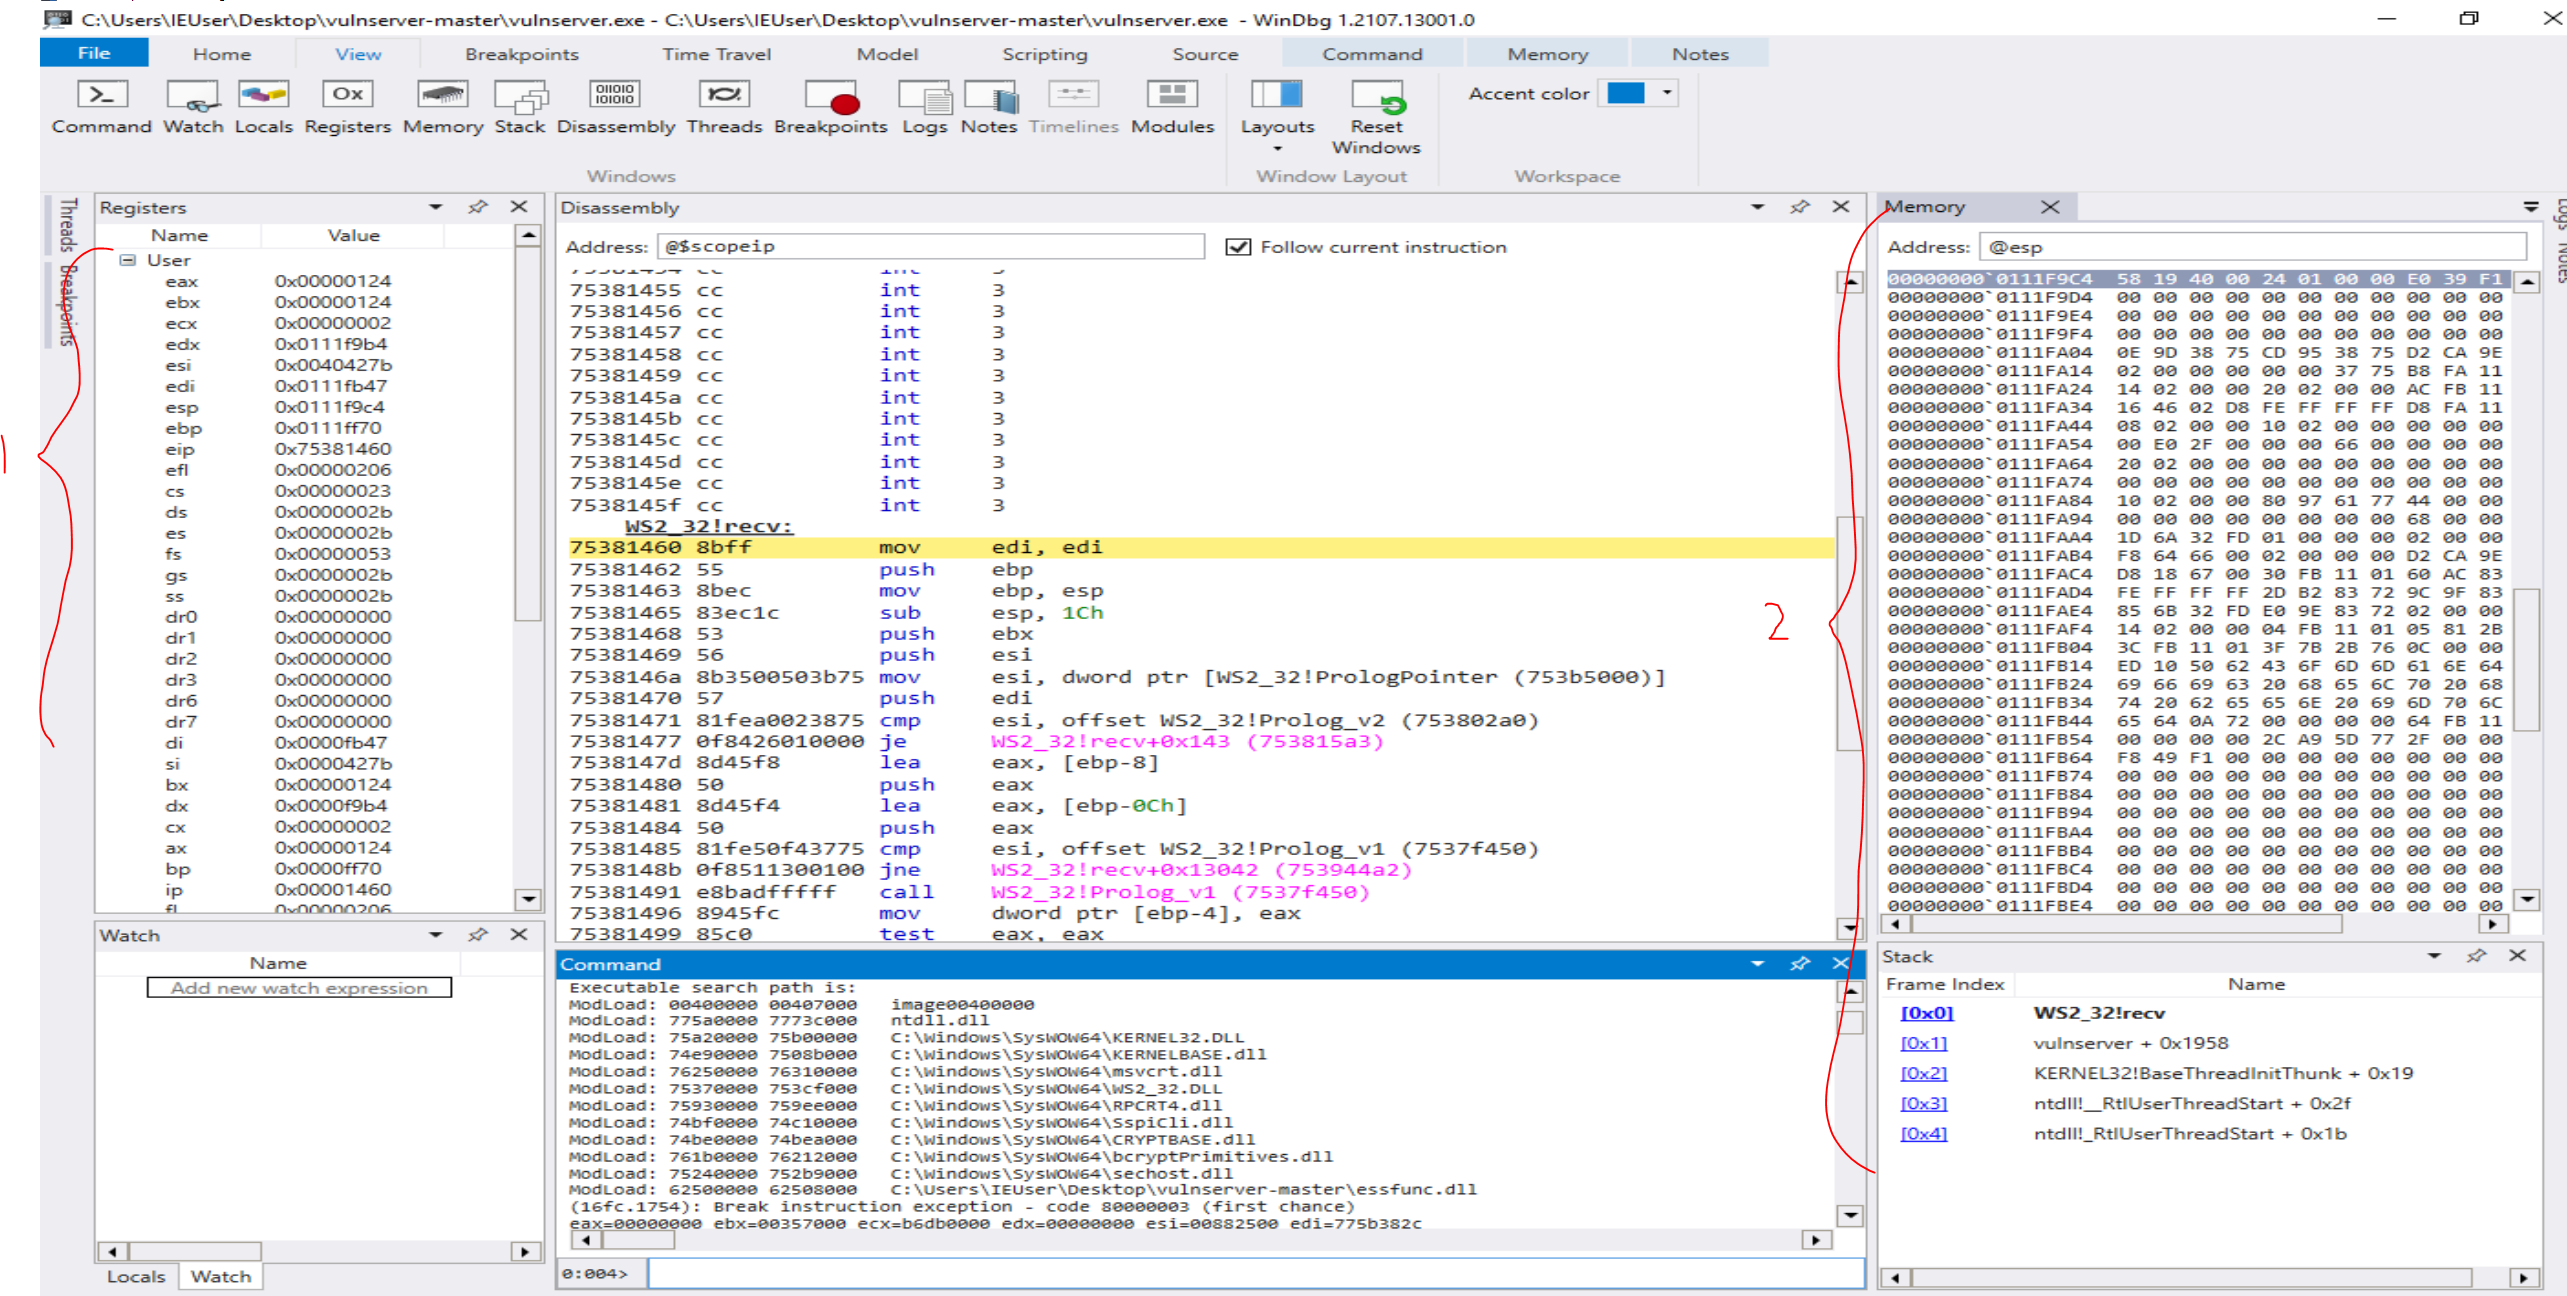
Note that:
(1) the registers do not show any dereferenced information
(2) the stack memory also shows no dereferenced values.
WinDbg Preview: After
My POC JavaScript file looks something like this at the time of posting (there is much to be improved): windbg_script.js
After saving the script to the Desktop and loading it in WinDbg Preview with:
.scriptload C:\Users\IEUser\Desktop\windbg_script.jsNote: If the script has already been loaded, you must unload the script first before reloading it.
.scriptunload C:\Users\User\Desktop\windbg_script.js; .scriptload C:\Users\User\Desktop\windbg_script.js; !chelpI now have access to a few commands.
!chelp shows me my custom help menu:
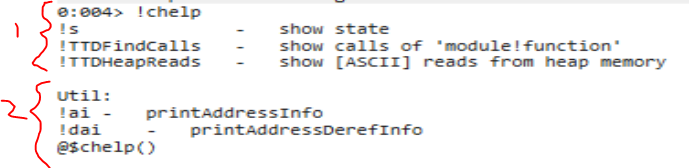
(1) functions for dumping the current state of the registers/stack, as well as some TTD functions I will discuss later
(2) some utility functions for dumping memory information given a specific address
The output of the !s ‘show state’ command is as follows:
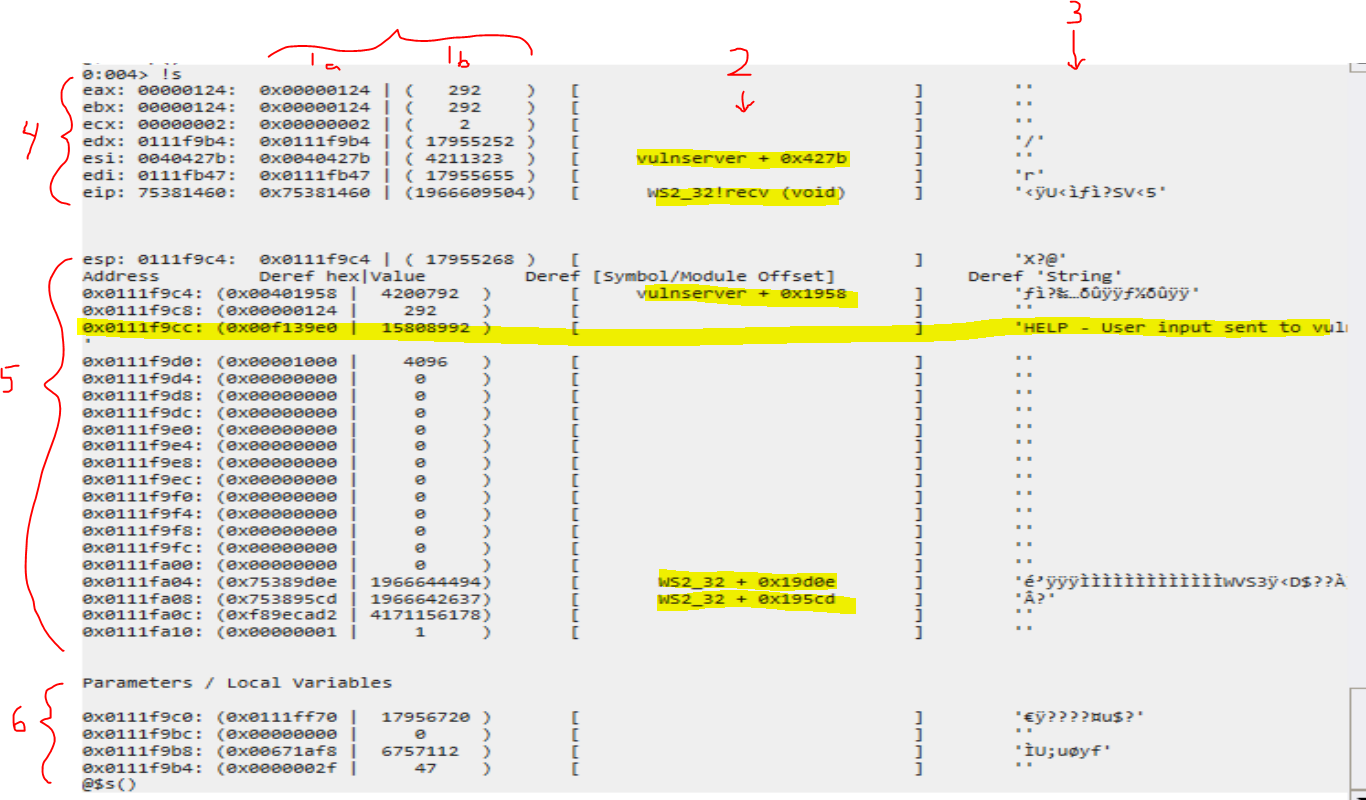
Vertical sections:
(1a) shows the dereferenced hex value for the given address
(1b) shows the decimal value of the hex
(2) attempts to resolve the symbol of the address location, also showing an offset to a given module (usually a function return address), if possible
(3) shows the dereferenced value as a string
Horizontal sections:
(4) registers
(5) stack, as pointed to by the ESP register
(6) possible parameters / local variables based on the ESP register
As we can see, some of the info that was available in x32dbg/x32dbg is now easily viewable. The user input “Help - User input send to vulnserver” was found in dereferenced strings. Additionally, module offsets are clearly visible for each applicable address.
While there is much to be improved, I definitely think this is a great step forward in improving the ease of use for WinDbg Preview.
Time Travel Debugging (TTD) Scripting
Time Travel Debugging lets you capture a debugged process and play it back later, a feature which apparently has existed internally to Microsoft for a while. This is very convenient as the alternative is to take snapshots of a machine and revert it in the event you want to step backward during the debugging process.
It seems like there are more resources slowly trickling out about the JavaScript API and TTD in general. Microsoft Docs and blogs like Diary of a reverse-engineer have been helpful in my understanding, and there are more resources being posted periodically as well.
In this section I will discuss the other functions in my !chelp command that I was experimenting with: !TTDFindCalls and !TTDHeapReads.
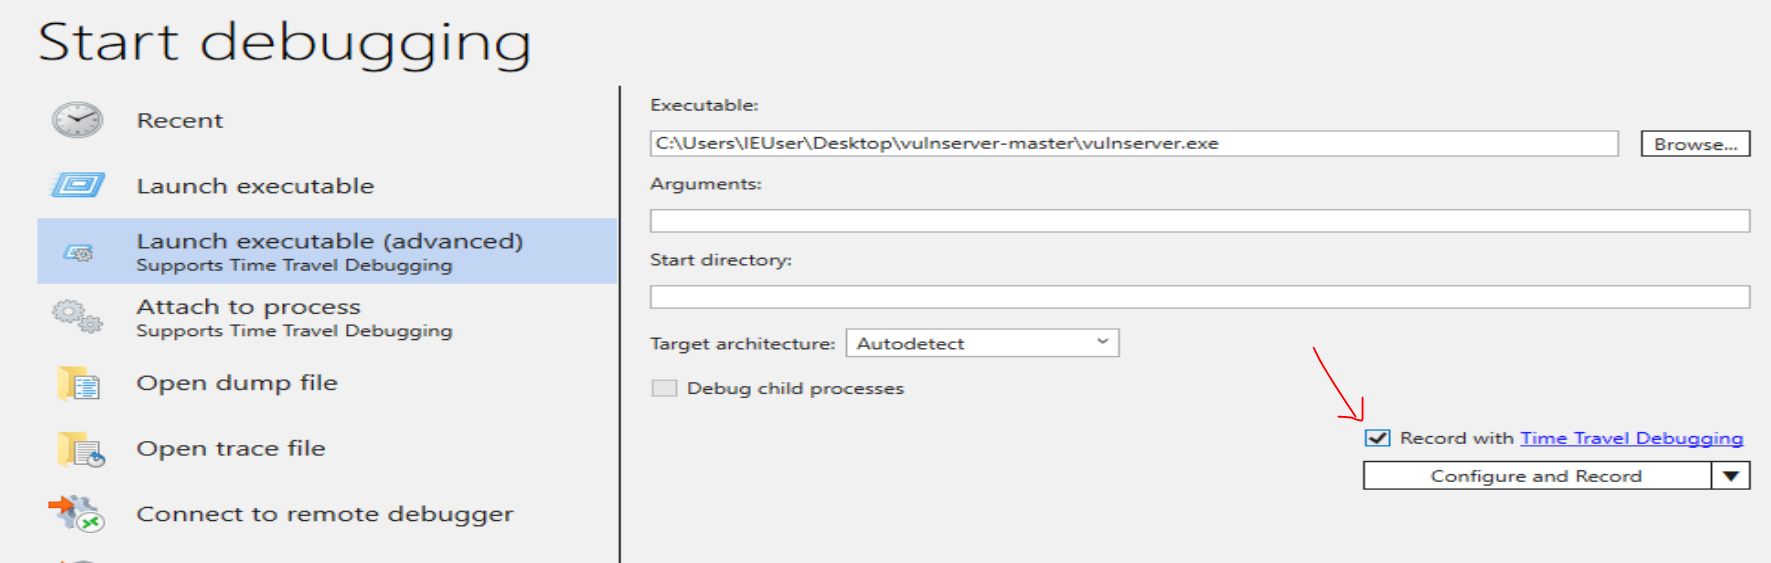
In order to run TTD functions, you must run WinDbg Preview as an Administrator and ensure the “Record with Time Travel Debugging” option is selected.
Once execution has been captured, you can open the capture file and explore the lifecycle of the process through WinDbg Preview.
!TTDFindCalls - show calls to ‘module!function’
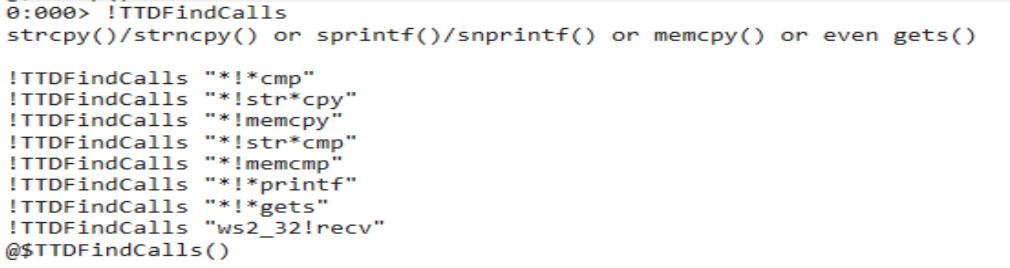
This command will find calls to particular functions of interest. Running the command !TTDFindCalls with no arguments displays a help menu with some possible example commands that may be of interest. The wildcard * can also be used when using the module!function format.
When looking for vulnerabilities in a binary, these commands can be useful for finding “vulnerable functions” that process user input; you can then immediately step to the point in time that input was processed in the TTD session, as shown in the examples below.
Example: !TTDFindCalls “ws2_32!recv”
To look specifically at the recv() calls, we can run
!TTDFindCalls "ws2_32!recv"The output will contain a list of calls.
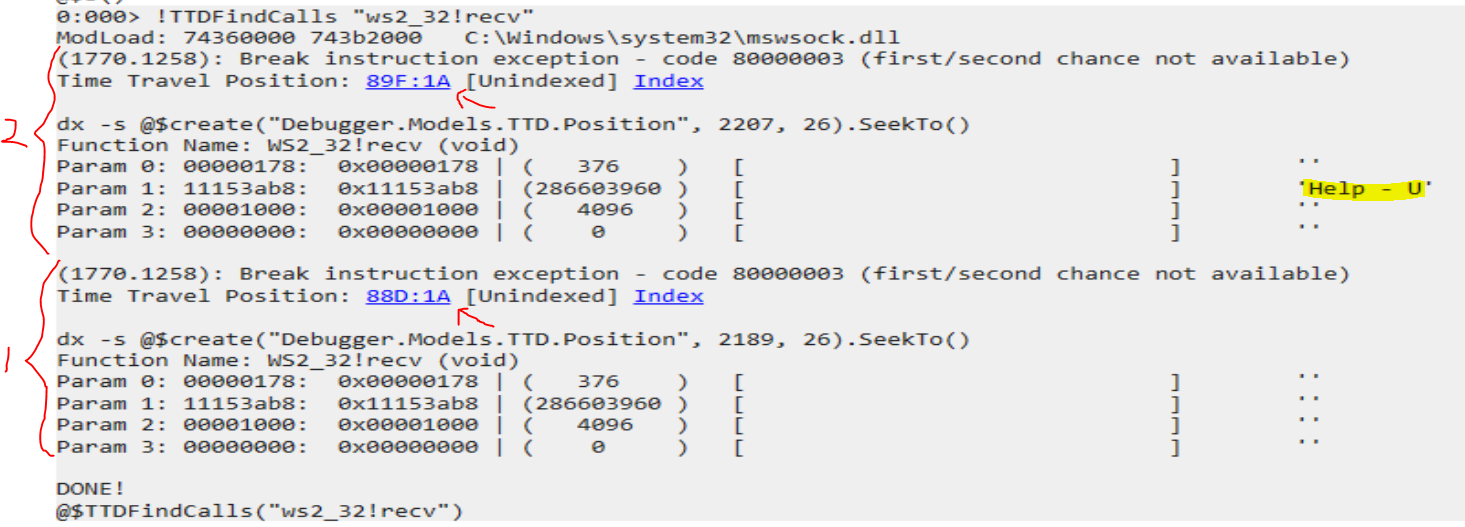
(1) is the first call to recv() - when we first connected using the command:
ncat localhost 9999
(2) is the second call to recv() - with the user input buffer (highlighted):
Help - User input send to vulnserver
The arrows point to links that, when clicked, will execute a command to navigate to the point in time that the function was called in the Time Travel Debugging capture.
Clicking on link (2) in the image above (when the custom user input was entered).
It will then run command (1) in the image below, and (2) set the current time in the debugging session to when that function was called.
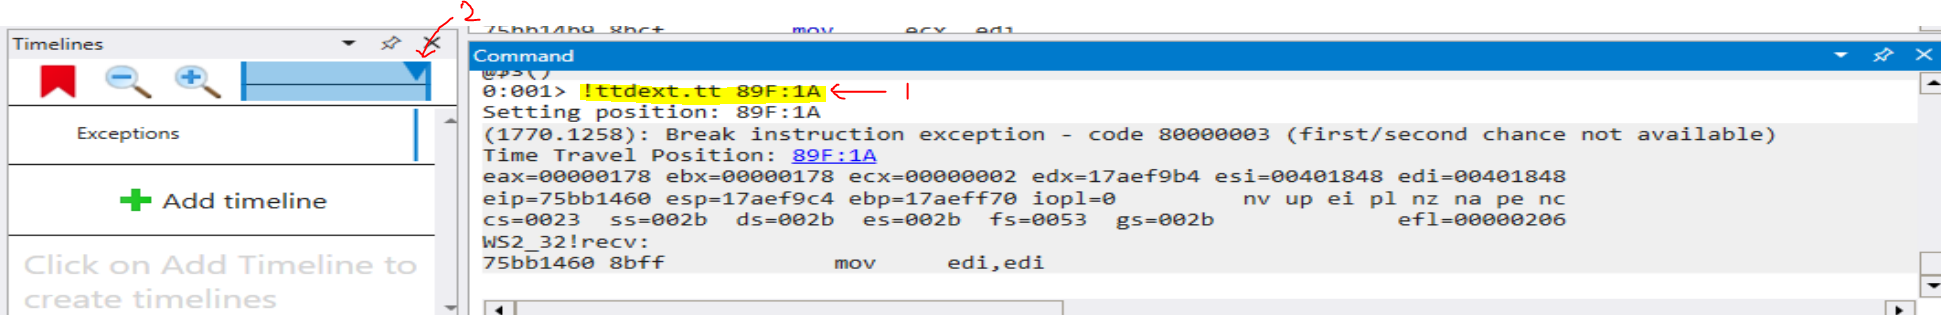
From here, I can quickly get the state of the registers and stack from when this function was called by calling my custom function !s.
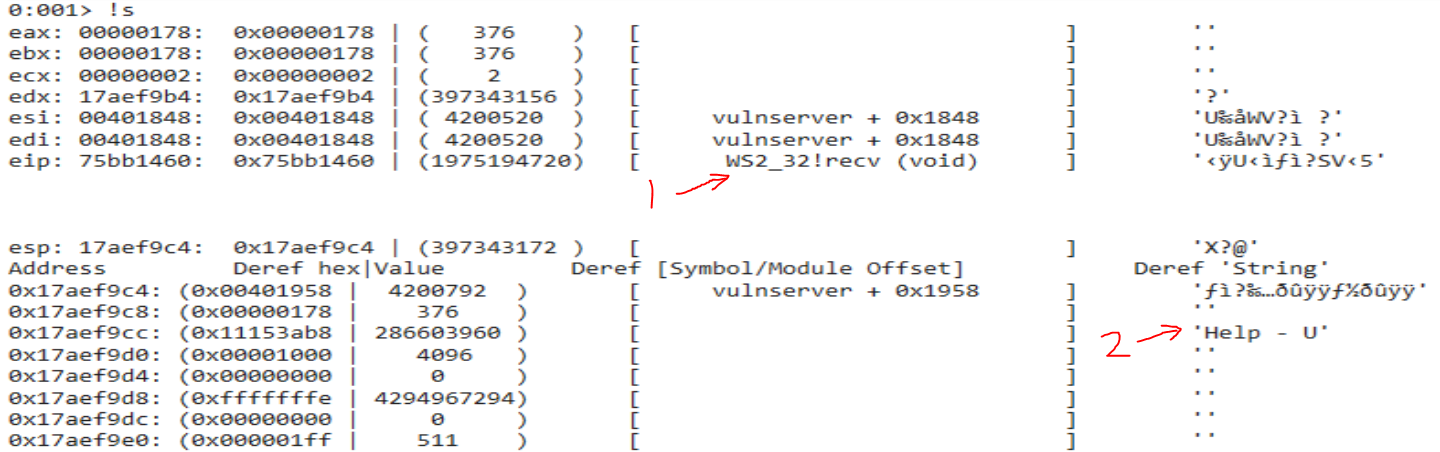
The output shows:
(1) EIP register points to ws2_32!recv
(2) Our user input buffer on the stack
Super fast and easy!
!TTDFindCalls ”*!*printf”
As another example, say I wanted to see all calls to printf:
!TTDFindCalls "*!*printf"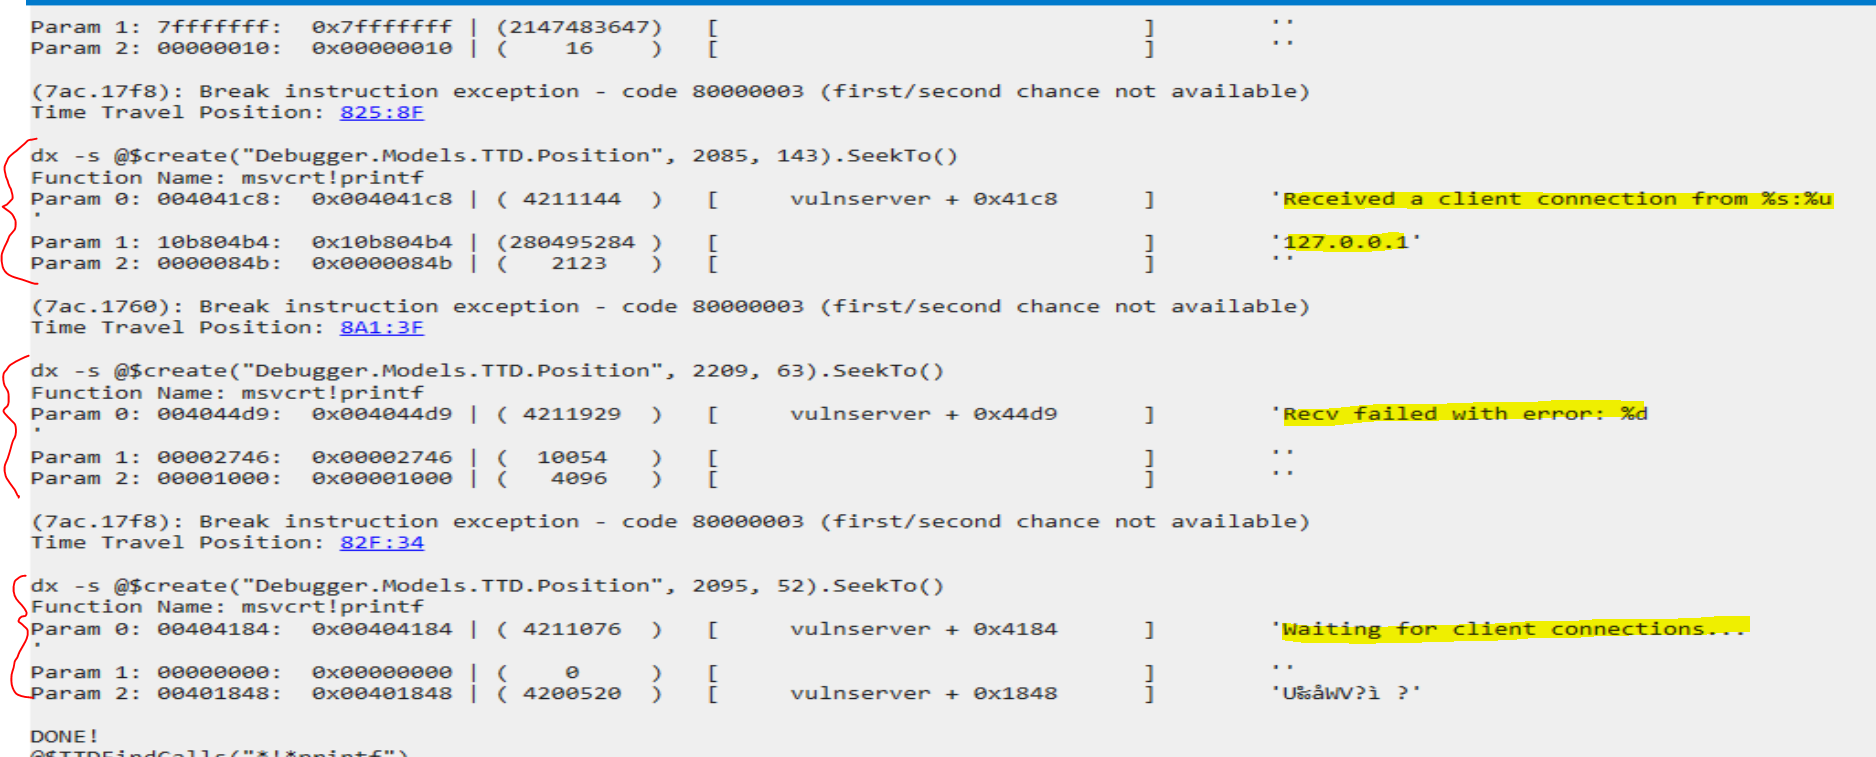
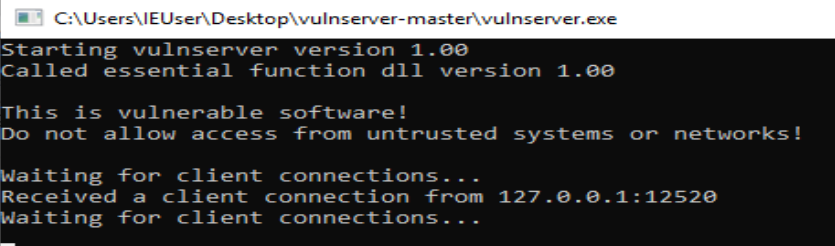
These strings are displayed to the vulnserver.exe window throughought the lifecycle of the process.
We can see, at a glace, the first couple parameters to each call of printf.
!TTDFindCalls “!strcmp”
To view calls to str*cmp:
!TTDFindCalls "*!str*cmp"Here, we see (3) strncmp() is called with parameters (1) and (2)
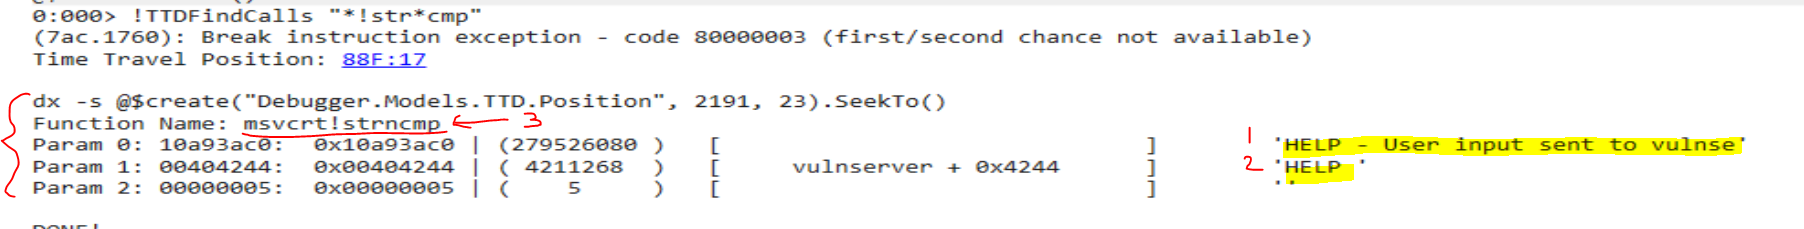
This is expected as, if you are familiar with vulnserver.exe, it will compare the user input with several of the possible commands.
Shown in IDA’s graph view, each of vulnserver’s possible commands are being checked on the user input ‘Str1’ using strncmp().
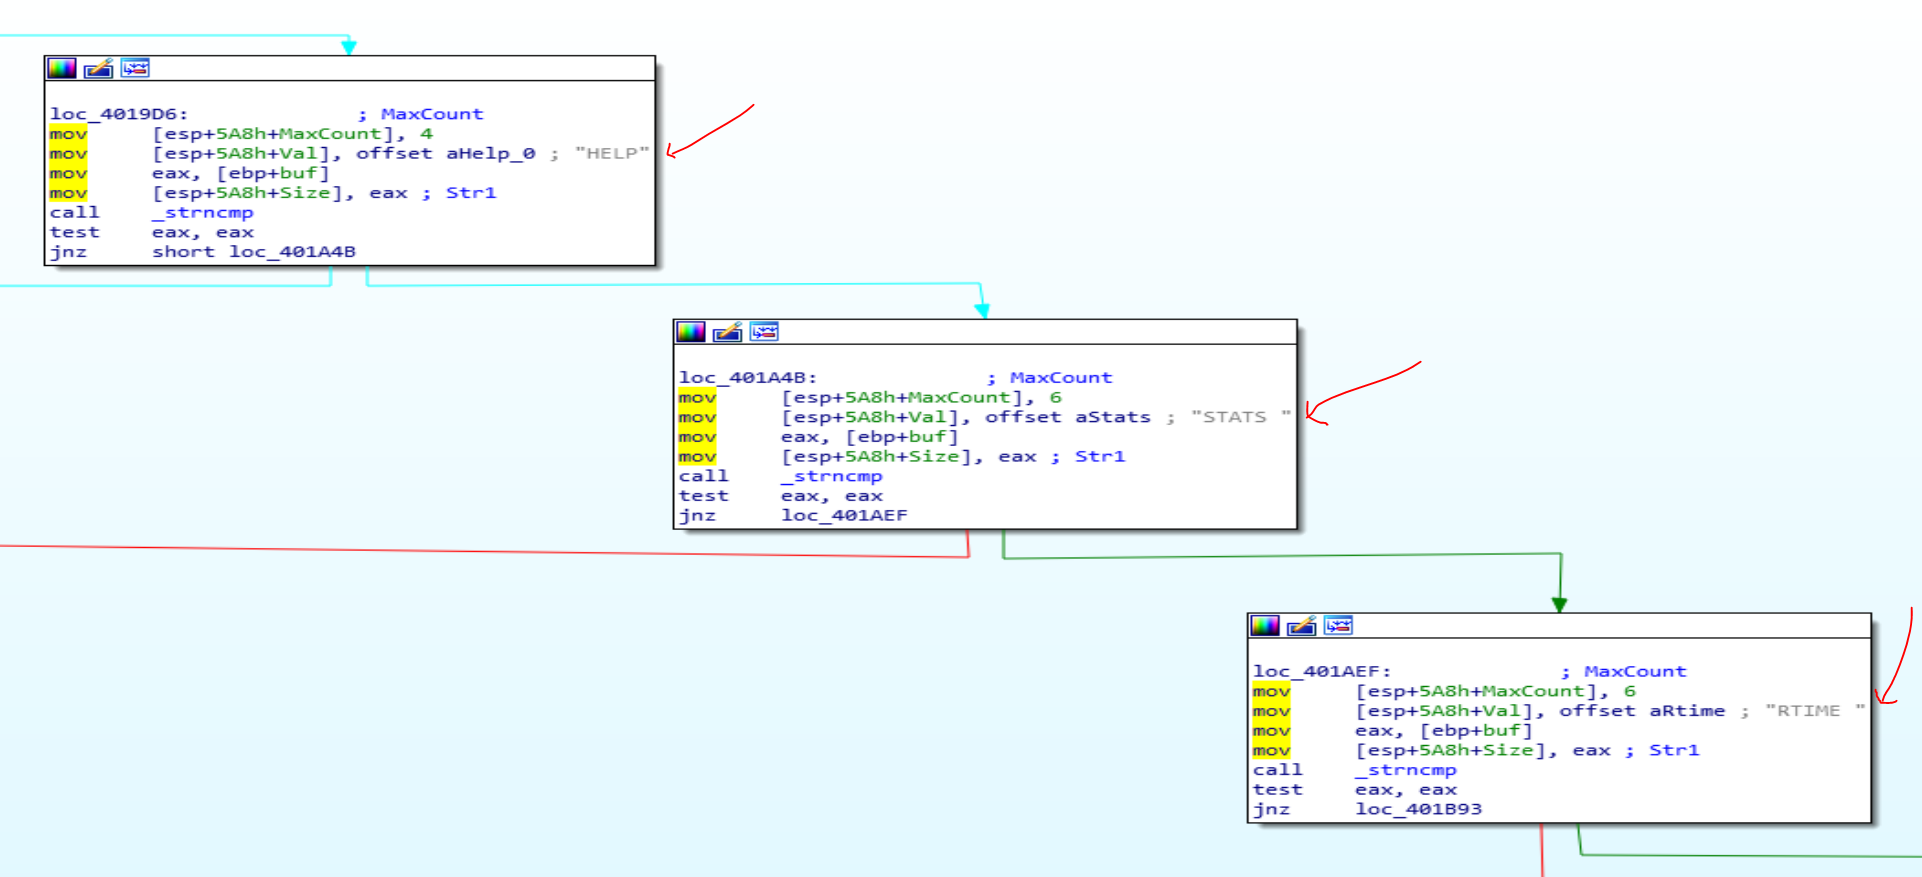
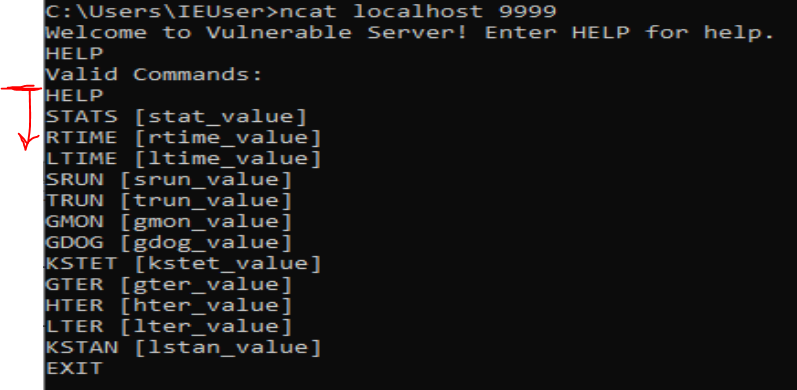
This lines up with the commands available in vulnserver. The program checks the start of the user input string against each of the commands available from the HELP menu of vulnserver.exe to determine the code path - basically a set of nested if statements.
BUGS
Unfortunately, I have noticed some inconsistencies with TTD in WinDbg Preview.
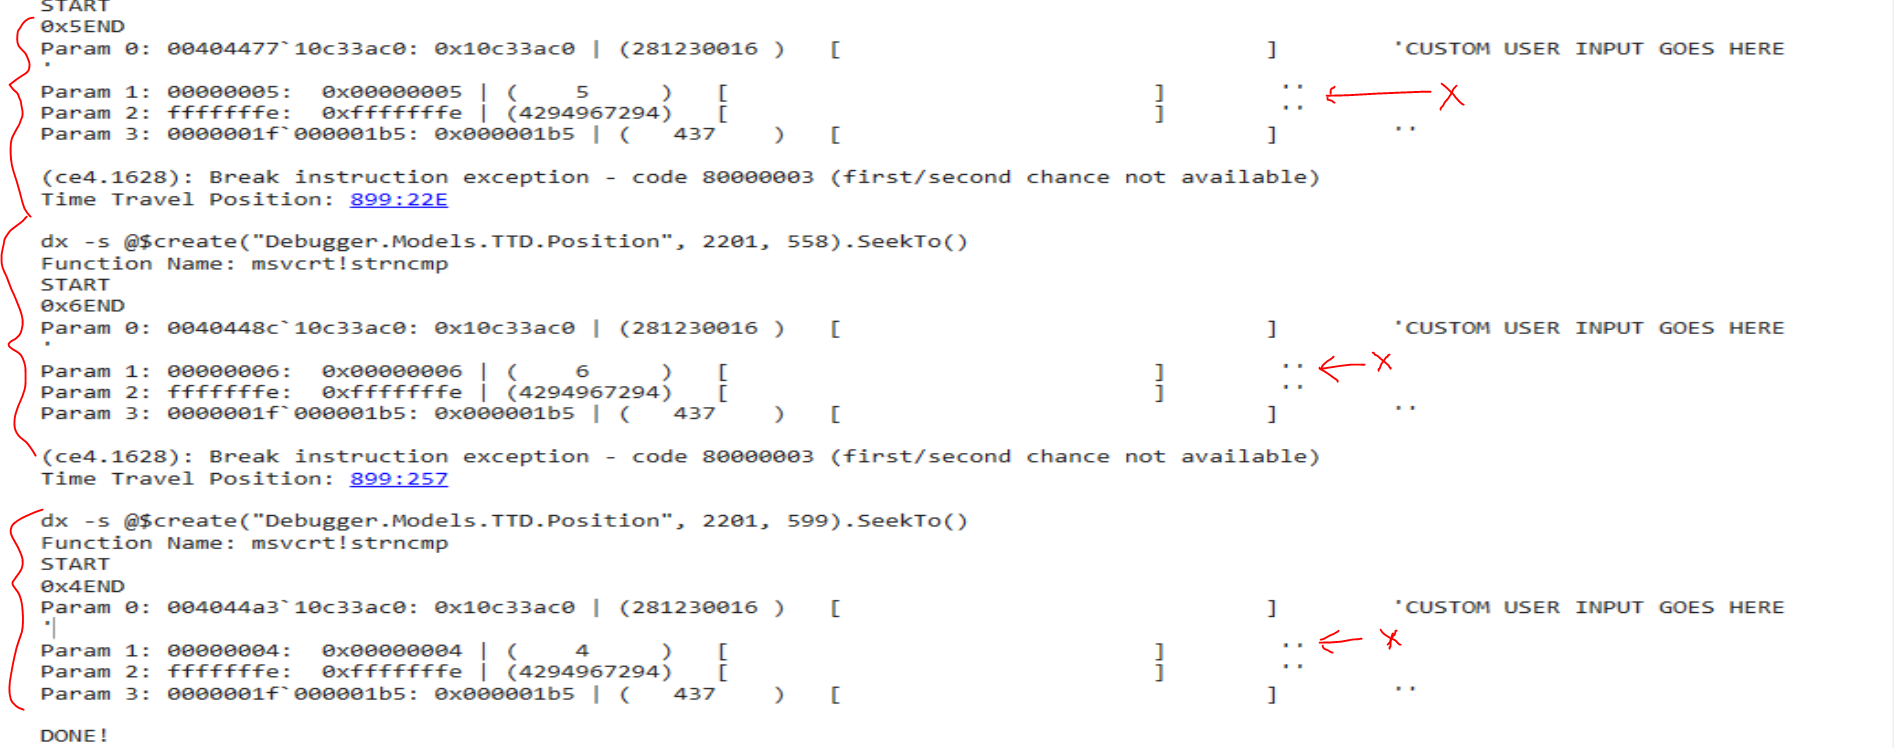
For this example, I re-ran the program using this user input (I needed a string that didn’t start with ‘HELP’ to hit the other vulnserver commands).
CUSTOM USER INPUT GOES HERERunning !TTDFindCalls "*!str*cmp" to dump function calls again yields in more calls to !str*cmp
The user string that is being compared is still visible, however, we cannot see the second string being compared
I’ll mention here that the commands run in the script can also be run from the console, like so.
WinDbg 'dx' command to pull the fourth call to str*cmp using the TTD api
dx -r1 @$cursession.TTD.Calls("*!str*cmp")[3]
dx -r1 @$cursession.TTD.Calls("*!str*cmp")[3].Parameters
The console output displays:
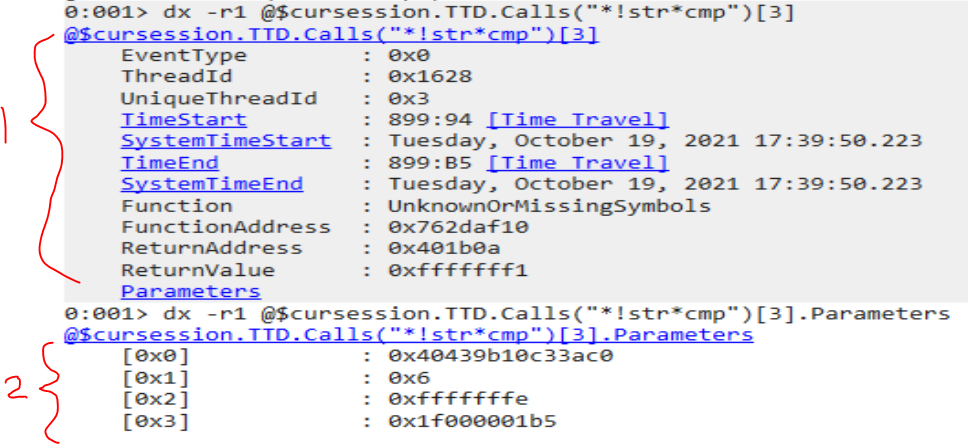
(1) details regarding the addresses of the function call
(2) parameters for the function call
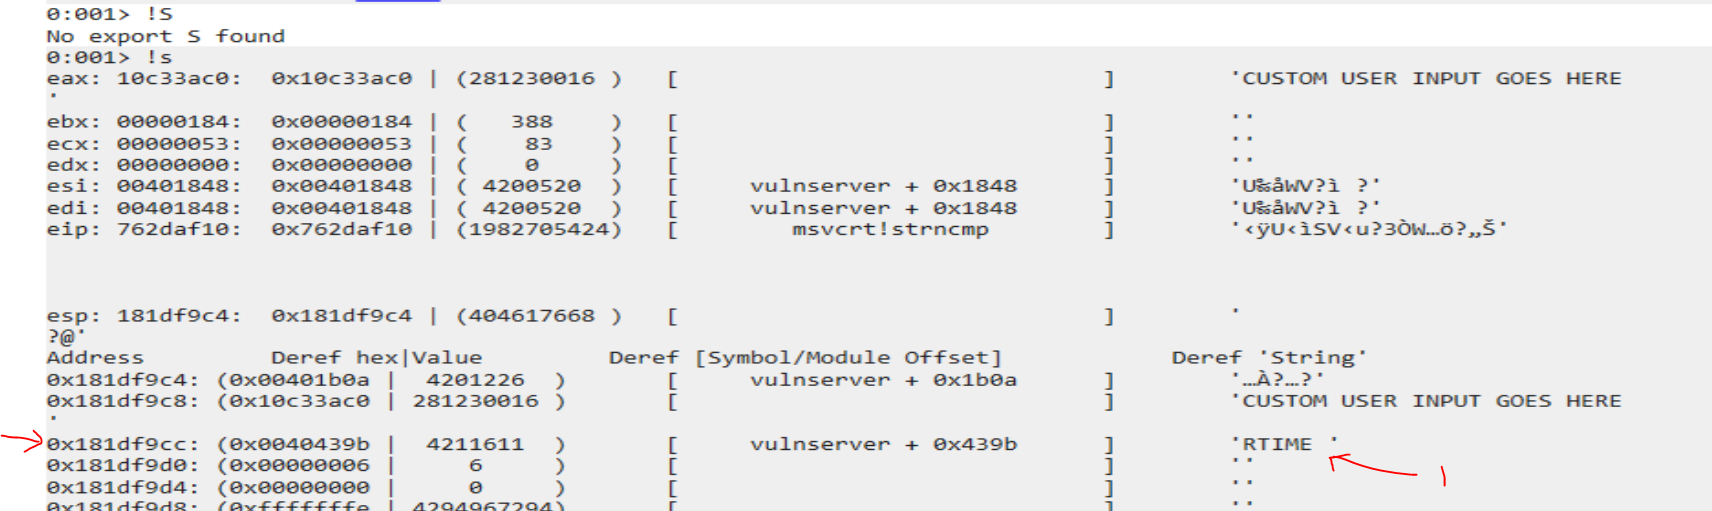
Navigating to the point in time the function was called by clicking the TimeStart link or running dx -s @$create("Debugger.Models.TTD.Position", 2201, 148).SeekTo() and running my custom !s command to dump the state of the registers and stack.
We can see the output shows:
(1) ‘RTIME ’ as the second string being compared against at address (2) 0x181df9cc on the stack, with a pointer to the string at address 0x0040439b
The astute observer will at this point notice that the addresses listed from the TTD api are different because values are being read as 64bit addresses instead of 32bit addresses… the vulnserver.exe I am executing is a 32bit application.
Parameters (addresses) of 32 bit process being read as if 64 bit
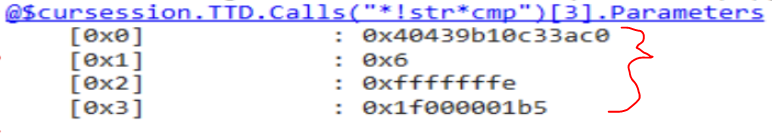
This clumping of values complicates things. I did some magic hand waving in my code to try and split the 64bit values into 32bit values and get a more sensible output. As you can see, the comparisons are much clearer.
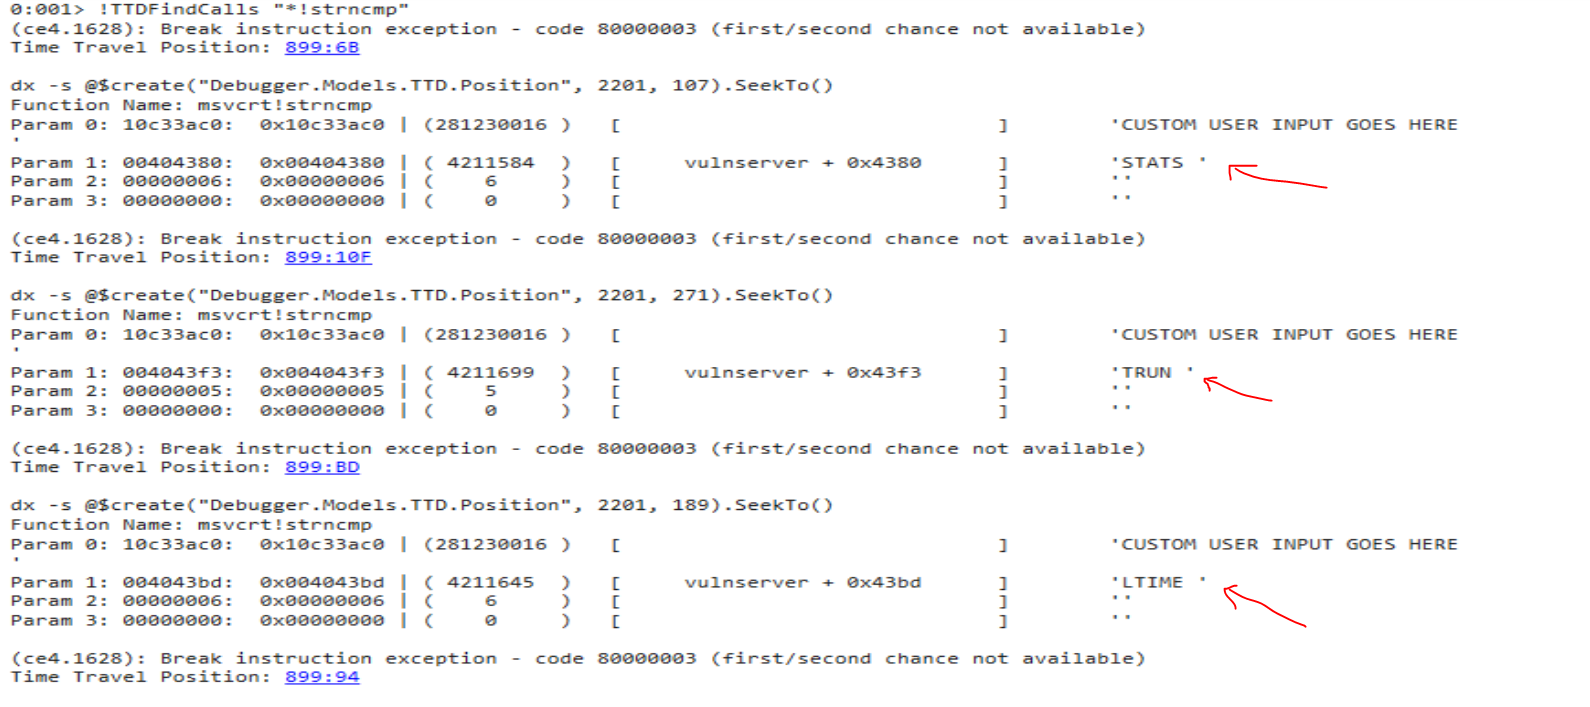
I wanted to point this difference in 64bit and 32bit because the TTD api is still quite new, so it may be a bit buggy. Although, in all fairness, I have no idea what I’m doing, and there may be a way to configure the output to display 32bit values given the program being debugged is 32bit. My expectation would be WinDbg would detect this upfront by either looking at PE header info or by some other means, but this doesn’t seem to be the case right now. Thus, my hacky solution seems to work, just know that it is very much a POC and I claim no robustness in its results.
Playing With Heaps
The last command of my custom functions is
!TTDHeapReads - show [ASCII] reads from heap memoryAs the name may imply, it looks for every time a heap memory location is read and prints if it the value contains some ASCII.
Why is this interesting?
Well, if you are fuzzing an application for vulnerabilities and have sent some user input, chances are that input was put on the heap at some point and will be read later. So say, for instance, you sent the payload “AAAAAAAAAAAAAAAAAAAAAAAAAAAAAAAAAAAAA” and wanted to see where it ends up. Just run !TTDHeapReads to view all the read memory and look for your payload!
The output will show the address of the data, the size, some commands you can copy/paste back into the console to view memory using Debugging Markup Language (DML) or a breakpoint command so you can break on the read and step through the instructions from there.
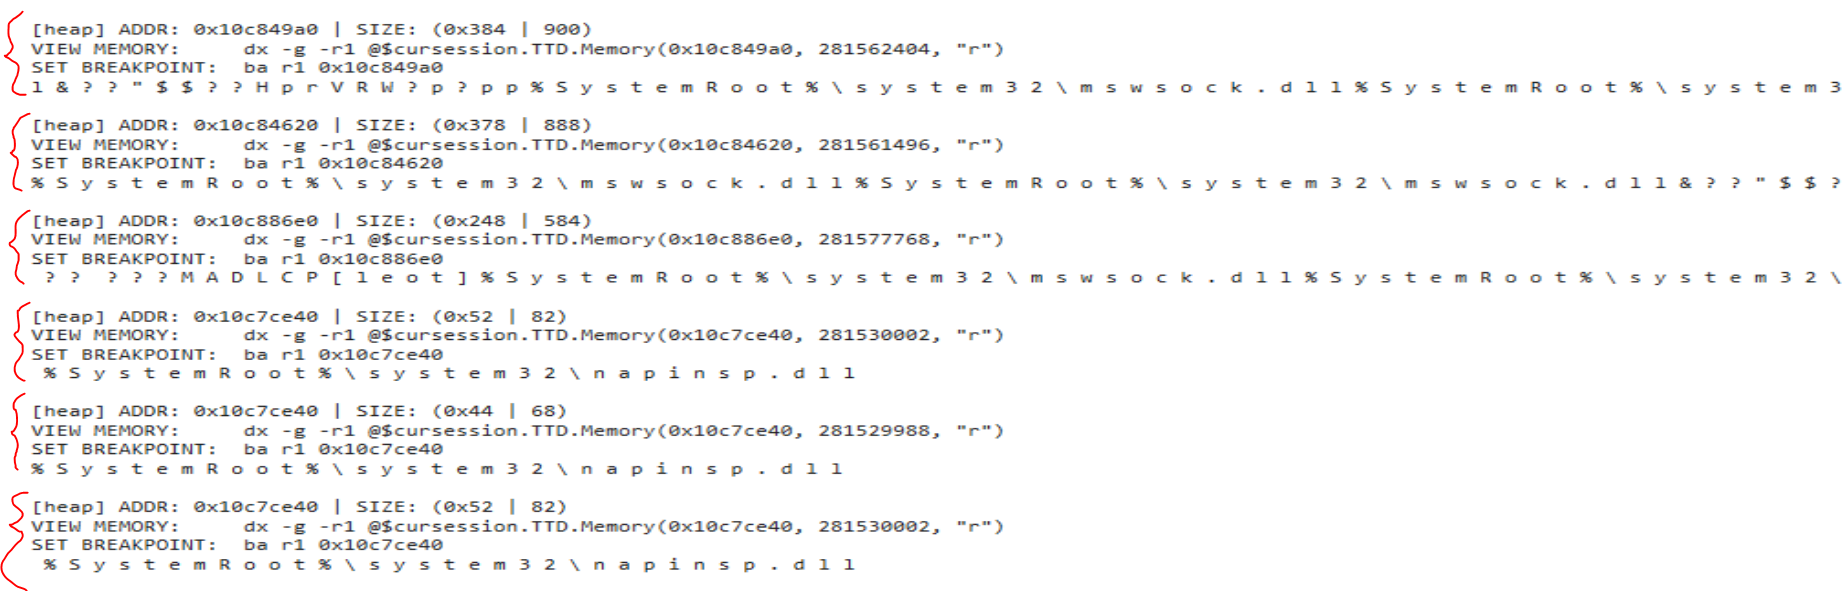
Right now the output is quite overwhelming and the console gets locked. However, some modification to optimize and search for your payload may prove fruitful.
This is just an interesting ability we have now using Time Travel Debugging and it’s been really fun to play with these new functionalities.
Bonus Content! Configuring WinDbg Preview
Throughout the course of this project I have experimented with downloading and configuring pykd and mona.py within WinDbg Preview. It was quite tricky and there are some important things to note if you try this yourself.
The dependencies and bit versions can get confusing, espeically since there is only one version of WinDbg Preview for both 32 and 64 bit processes - keep in mind you should be installing and running modules based on the bit version of your target process (the process you are debugging).
Useful command to view the extension paths being loaded within WinDbg console:
.extpathDisable/Uninstall Windows Defender
It may be worthwhile knowing how to diable or uninstall Windows Defender as it can flag files or vulnserver.exe as malicious.
# temporarily disable
Set-MpPreference -DisableRealtimeMonitoring $true

# or uninstall completely w/ RSAT: Server Manager feature installed for the servermanager module
Uninstall-WindowsFeature -Name Windows-Defender
Installing WinDbg Preview Offline
In order to install WinDbg Preview offline, you can download an offline .appx file from the Microsoft store. This can easily be transferred to your offline machine and installed with some PowerShell.
Add-AppPackage WinDbg_Preview.appxA github issue has been opened for shipping WinDbg Preview out of the Microsoft Store - it may be worth checking it’s status periodically.
Python versions
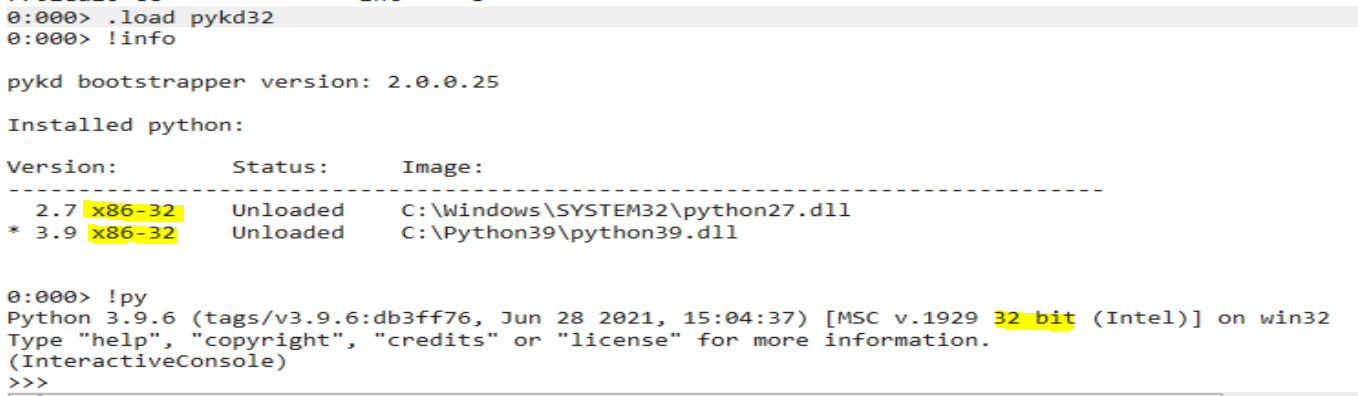
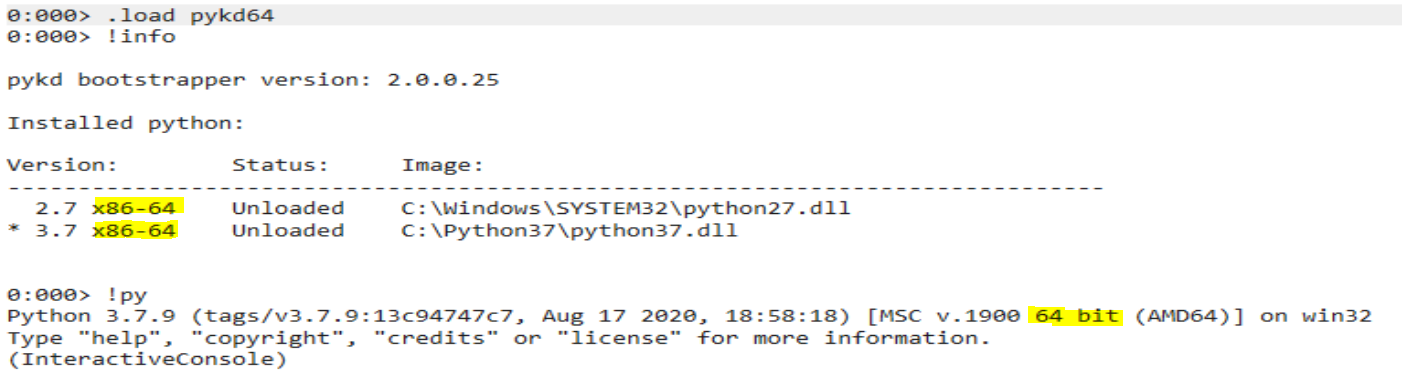
Make sure python is the same bit version as the program you are debugging. When loading the pykd modules, you’ll notice the bit version and paths of the python.dll being used is different for each bit versionn.
x86 - debugging target: 32 bit vulnserver.exe
x64 - debugging 64 bit calc.exe
Also note that to use python 2.7, you can just use the -2 parameter in WinDbg Preview:
# python 3
!py
# python 2
!py -2
Configuring pykd.dll
Pykd is a utility that will allow you to execute python in WinDbg and run scripts to automate your debugging. I found this article to be quite helpful in helping me find a workable solution.
It seems there are multiple methods of downloading and installing pykd. I found it easiest to download the .dll from the pykd repository and place it in a directory that is lisited in the Path environment variable.
According to this post you can, in theory, add the 32bit .dll to C:\Users\<user>\AppData\Local\DBG\EngineExtensions32 and the 64bit in C:\Users\<user>\AppData\Local\DBG\EngineExtensions. However, WinDbg was still not loading the module and I ended up creating a new directory, added it to the Path environment variable, and .load pykd seems to work. However, using this technique, I would reccomend changing the pykd.dll names to something like pykd32.dll and pykd64.dll so it’s easy to specify which one you want to load.
Make sure the pykd.dll bit version matches the bit version process you are debugging!
.load pykd32.dll
.load pykd64.dll

# you can also specify the full path
.load C:\...\pykd32.dll
.load C:\...\pykd64.dll
Basically, the steps I used are:
- Create directory
- Update Path environment variable with new directory
- Place pykd.dlls into directory, renaming to pykd32.dll and pykd64.dll
- Load correct bit version into WinDbg Preview using
.load
You should now be able to pip install pykd and run commands/scripts from WinDbg Preview. I will go through some troubleshooting in the mona.py section below, it may help with some additional roadblocks.
Configuring mona.py
Note that mona.py was originally made for 32bit processes, so keep this in mind if you are trying to load it for 64bit processes.
First, download mona.py and place the script in the same location as the pykd.dlls.
Second, per the mona installation instructions, also download windbglib.py and place it in the same folder as mona.py and the pykd.dll.
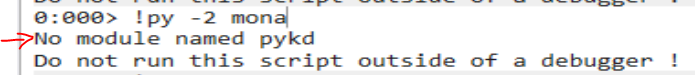
You may notice mona.py still won’t run.

This message is not very verbose. We can modify the mona.py script to print a more useful error message.
Script - Before:

Script - After:
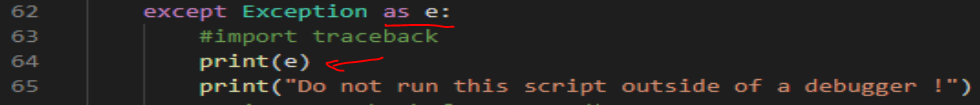
The new error message:
From here, it was a bit tricky to download as I didn’t have pip installed for the x86 version of mona.py.
I installed pipensure and pykd from the cmd prompt. In my case, the location of the x86 python.exe is C:\Python27.x86.
Install pipensure and pykd (run from cmd/powershell terminal)
C:\Python27.x86\python.exe -m ensurepip
C:\Python27.x86\python.exe -m pip install pykd
You should be able to call mona.py now from WinDbg Preview
!py -2 mona.py 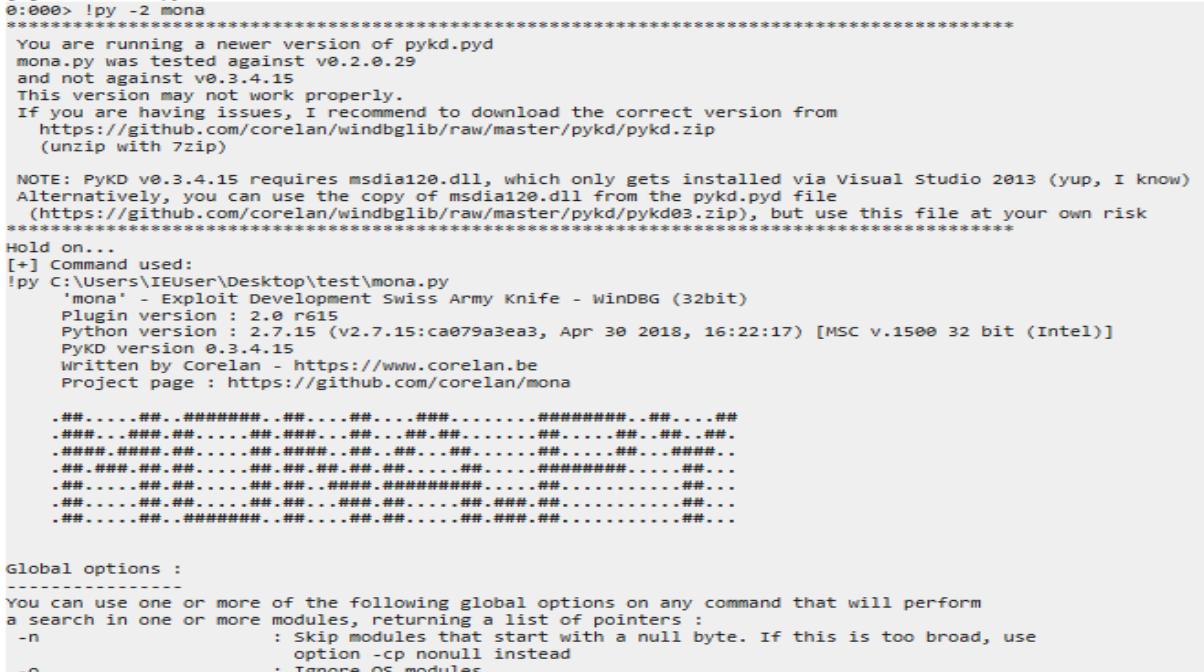
A test command to test things are working
!py -2 mona seh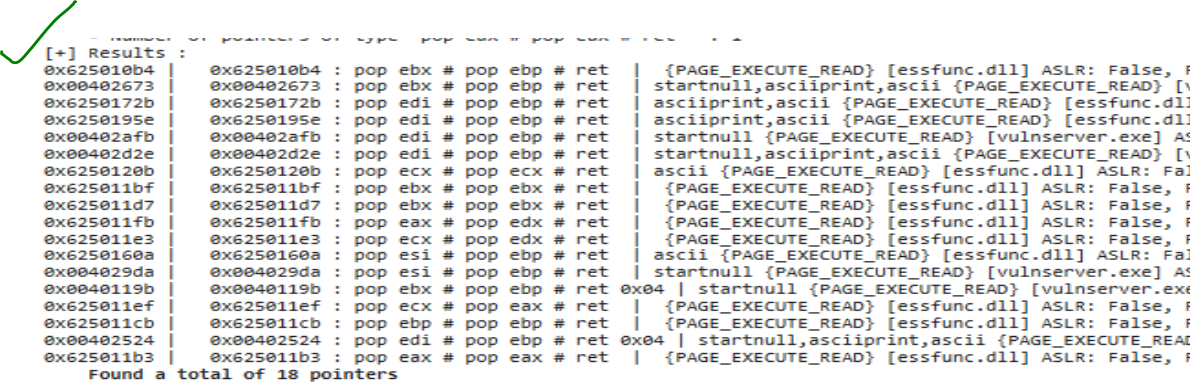
Very nice!
Setting this up correctly has proven to be a significant challenge. Tinker long enough and you should be able to get it.
Other extensions
There are loads of cool extensions like this grep extension that can simplify other tasks in WinDbg. A nice list of extensions to check out can be found in this repo: awesome-windbg-extensions.
OSED Script (epi) Modified for WinDbg Preview
Epi has a seriously amazing blog, and not only that, he also has open sourced his OSED scripts! What a guy!
Among these scripts is an interesting script called attach-process.ps1 to launch WinDbg, open/attach to a process, and execute some commands such as importing your custom modules/scripts into the newly spawned WinDbg session. More details can be easily found here.
I mention this because it will not work with WinDbg Preview. You must modify some of the parameters as such:
Original
$cmd_args = "-WF c:\windbg_custom.wew -p $($process.id)"

if ($commands) {
    $cmd_args += " -c '$commands'"
} else {
    $cmd_args += " -g"
}

write-host "[+] Attaching to $process_name"
start-process -wait -filepath "C:\Program Files\Windows Kits\10\Debuggers\x86\windbg.exe" -verb RunAs -argumentlist $cmd_args
Modified
$cmd_args = @("-p", $process.id)

if ($commands) {
    $cmd_args += "-c"
    $cmd_args += "`"$commands`""
} else {
    $cmd_args += "-g"
}

write-host "[+] Attaching to $process_name"
write-host WinDbgX $cmd_args
start-process -wait -filepath "WinDbgX " -verb RunAs -argumentlist $cmd_args
This seemed to work for me. It changes the way arguments are parsed and passed to the start-process command for WinDbg. It may not be perfect as I was just playing around, but hopefully this speeds up your time of getting a workable script for WinDbg Preview. Note that passing any argument that requires double quotes will fail, so this does get a bit finnicky.
An example usage, using absolute paths (loads pykd.dll + my custom .js script):
while ($true) {
    ."Z:\newvm\x86\attach-process-PREVIEW.ps1" -path "Z:\newvm\vulnserver-master\vulnserver.exe" -process-name vulnserver -commands ".load C:\Users\IEUser\Desktop\test\pykd32; .scriptload C:\Users\IEUser\Desktop\test\windbg_script.js"
}
Conclusion
This has been a summary of some of my experiments with WinDbg and some resolutions to the pain points I had to troubleshoot. While these scripts/soluutions are not fully baked, I hope they at least help someone jumpstart their WinDbg Preview experimentation. Happy debugging!